Everything you run.
One place to see it.
Logs, metrics, traces and APM — plus the agents you’re now shipping to production. OpenTelemetry-native, on a data lake you can afford to keep.
- open source
- OpenTelemetry-native
- no credit card
- gen_ai.provider.name
- openai
- gen_ai.operation.name
- chat
- gen_ai.request.model
- gpt-4o
- gen_ai.usage.input_tokens
- 892
- gen_ai.usage.output_tokens
- 520
- gen_ai.response.finish_reasons
- ["stop"]
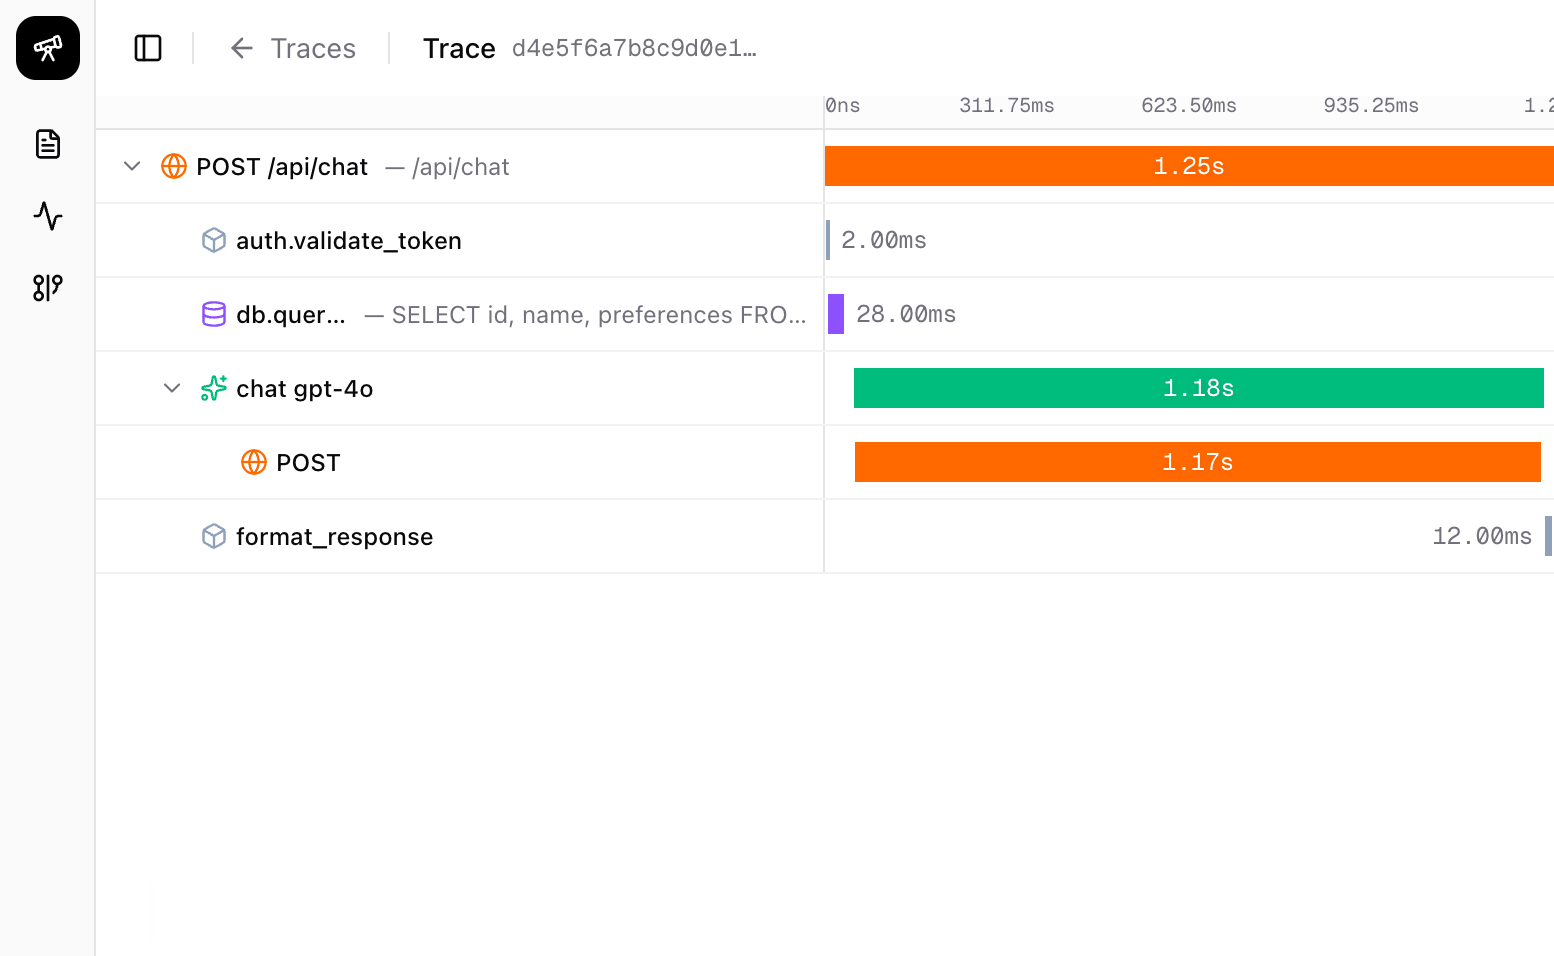
One request, six spans, three systems — and 94% of the latency sitting in a single model call. Select any span to read its attributes.
- logs
- metrics
- traces
- profiles
- events
- llm spans
- OTLP
- PromQL
- SQL
Why we built this
Observability got expensive, closed, and blind to half your stack
The tooling most teams run was designed when a service was a service and storage was the expensive part. Both assumptions have since expired.
The bill decides what you keep
You sample traces, drop debug logs and cut retention to thirty days — none of it for engineering reasons. Then the incident happens outside the window, and the data you needed was deleted to make a number go down.
Your telemetry is in someone else's format
Ingest is cheap to start and expensive to leave. The data you paid to collect is queryable by exactly one UI, and moving it means rewriting every dashboard, alert and runbook you own.
Nothing was built to watch a model
Services that call models emit more spans, larger payloads and a failure mode traditional APM has no concept of: a response that returns 200 and is wrong. You see the HTTP call. You don't see the reasoning.
Tracing & APM
Follow one request through every service that touched it
Distributed traces across your APIs, queues, databases and model calls, with the attributes intact. Jump from a slow endpoint to the exact span that caused it — no sampling gaps, no reconstructing the path by hand.
Logs & metrics
Every field indexed, every label kept
High-cardinality attributes stay queryable instead of being dropped at ingest. Write PromQL against your metrics, filter logs on any field, and pivot to the trace that produced them without leaving the page.
Agents & models
The AI parts of your stack are just more spans
Model calls, tool invocations and agent steps arrive as OpenTelemetry GenAI spans — prompt, response, tokens and cost attached. They sit in the same trace as the HTTP request that started it, because that’s where they belong.
Your whole system, including the parts that think
Live topology built from your traces — services, queues, databases and model calls, with latency and error rate on every edge. When something degrades, the path to it is already drawn.
The foundation
Open tables in your bucket, not rows in our black box
Sightly writes every signal to a data lake as Apache Iceberg tables in open Parquet files. We query it to run the product. So can anything else you own.
Anything that speaks OTLP
- OTel Collector
- OTel SDKs
- Prometheus
- Fluent Bit
No proprietary agent to install, and nothing to rip out if you leave.
Iceberg tables on object storage
- traces/*.parquet
- logs/*.parquet
- metrics/*.parquet
Columnar, compressed and partitioned by day. Readable by every engine that reads Parquet.
Sightly, or whatever you prefer
- SightlyUI, alerts, dashboards
- Sightly AI SREinvestigates over MCP
- DuckDBad-hoc analysis
- Spark / Trinoyour warehouse jobs
Humans and agents hit the same tables. Your telemetry is a dataset you own, not a screen you rent.
Retention is a storage decision
Keeping thirteen months of spans costs what thirteen months of object storage costs. There is no retention tier to negotiate, because retention isn't a feature we can withhold.
Open source, self-hostable
Run the whole platform yourself. The same code we operate, in your own cluster, against your own bucket — no reduced community edition holding back the parts that matter.
Bring your own cloud
Deploy into your own account so telemetry never crosses a boundary your compliance team has to sign off on.
AI SRE
An on-call engineer that has already read every span
Because nothing was sampled away and nothing aged out, there is a complete record to investigate. Sightly’s agent queries the same lake you would, and arrives with a hypothesis and the evidence behind it — not a chat box bolted onto a dashboard.
- Correlated with a deploy
checkout-api@4a91c2 shipped 14 min before the first breach
1 deploy marker - Scoped the blast radius
1 of 12 services · 4,812 traces affected · 0.31% error rate
4,812 traces - Found the regression
db.query SELECT … FROM users went 28ms → 1.4s at p95
3 traces · 1 metric - Drafting the fix
migration 0042 dropped idx_users_email — proposing a restore
awaiting review
- It starts before you do
- The investigation runs when the alert fires, not when someone opens the laptop. By the time you read the page, the timeline above already exists.
- It shows its work
- Every claim links to the trace, log line or metric it came from. You can check the reasoning instead of trusting a summary — and reject it when it's wrong.
- It reads what you read
- Same lake, same queries, over MCP, CLI and API. There is no privileged index it can see and you can't, and no rate limit on your own data.
- It proposes the changeOn the roadmap
- A reviewable diff against the service that broke, with the evidence attached to the pull request.
One console
Stop paying four vendors to tell you the same thing
Telemetry stored this month
4.82 TB
13 months retained across all services, unsampled
| Service | Spans | Logs | p99 | Error rate | vs. last week |
|---|---|---|---|---|---|
checkout-api | 12.4M | 88.1M | 241ms | 0.04% | -8.2% |
gpt-4o-router | 4.2M | 9.7M | 1.18s | 0.31% | +3.2% |
postgres-primary | 31.2M | 2.1M | 28ms | 0.00% | -12.4% |
You are one exporter block away
Point an OpenTelemetry collector at Sightly and traces show up in seconds. Nothing to rip out, and nothing that can’t be pointed somewhere else tomorrow.
exporters:otlphttp:endpoint: https://ingest.sightly.ioheaders:authorization: Bearer ${SIGHTLY_TOKEN}